The dashboard
The dashboard opens via File > Statistics (dashboard + traps)… (Cmd + Shift + D). At the top, filters frame the diagnosis: the time control (blitz, rapid…), the period, and the scope — the whole library, or My games only.
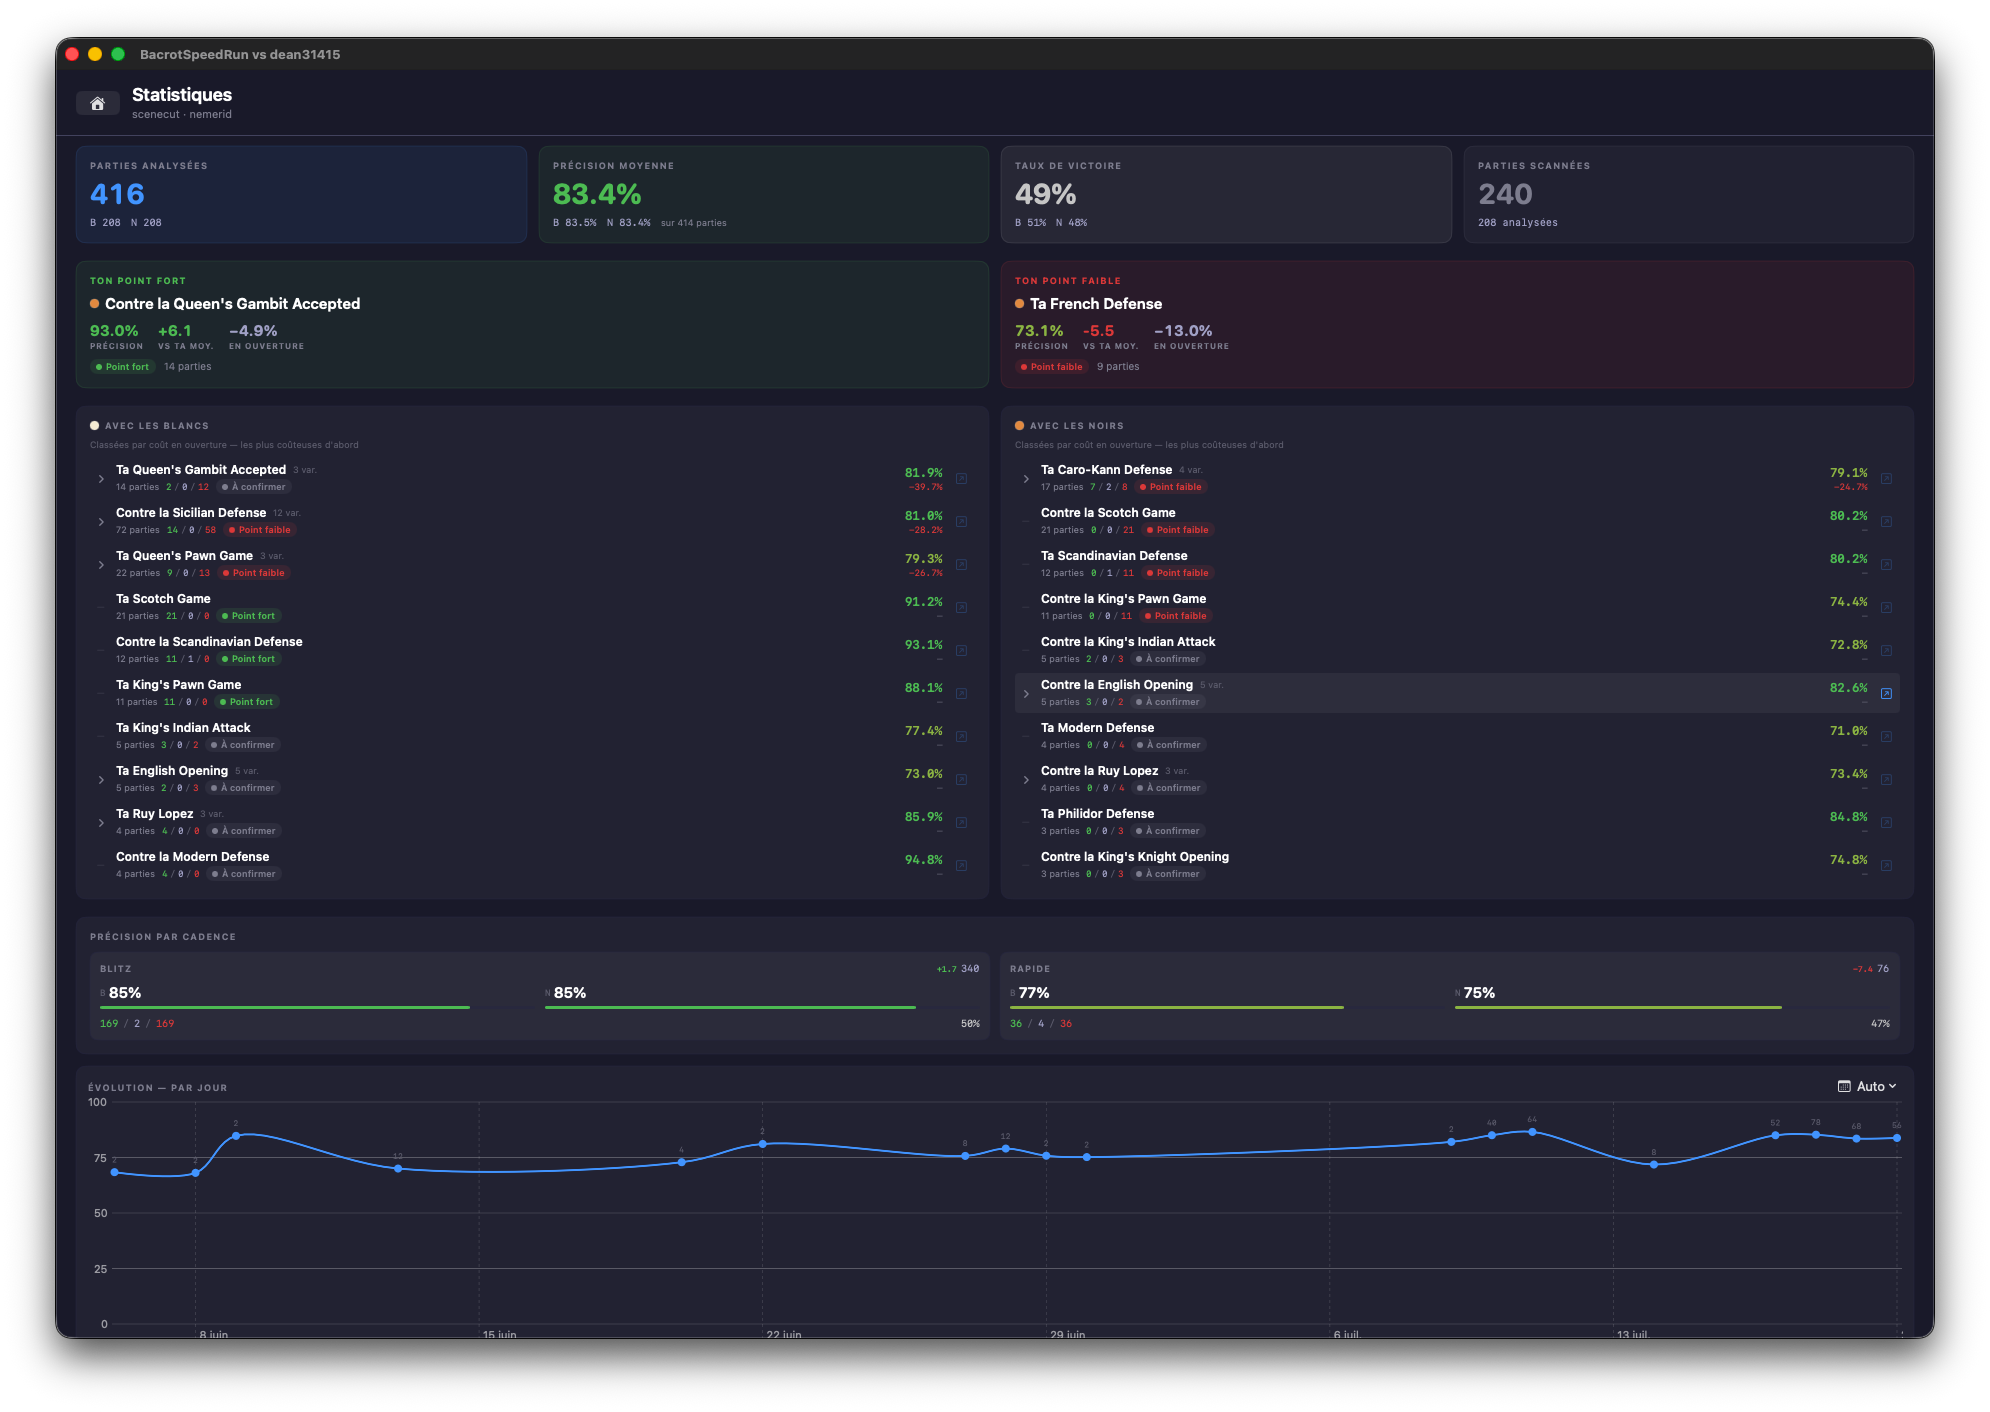 The diagnosis at a glance: what works on the left, what costs points on the right.
Your strengths, your traps
The top panels name the essentials: your strength and your weakness — the opening where your accuracy most exceeds your average, and the one where it collapses, with the win/draw/loss record. Below, two full lists: the openings where you dominate and the openings to work on — your recurring traps, those game starts where you lose more than your average, game after game.
A precious nuance: each line distinguishes My repertoire (the opening you choose to play) from Opponent’s (the one imposed on you). A trap in an opponent’s opening calls for a prepared answer in a study; a trap in your own repertoire questions the repertoire itself.
The openings table
The central table sums up all your openings: ECO code, number of games, record, accuracy, and the gap to your average. Each family unfolds into variations — the Caro-Kann can be globally healthy and its Exchange variation catastrophic; that’s exactly the kind of truth this table reveals.
The move distribution
Two rings — one per color — break all your analyzed moves into the eleven categories, from Brilliant to Blunder. The useful reading is comparative: more mistakes with Black than with White? A Book-move rate that plateaus early? Every asymmetry is a lead.
Activity and opposition
The 90-day activity calendar shows the playing rhythm — active days, daily peak. And the performance by opponent Elo table splits your results by rating bracket: win rate and accuracy against weaker, equal and stronger players.